Commodity Trading
Market Intelligence from Vessel Movements
Gain trading edge with real-time tanker tracking, chokepoint monitoring, and trade flow analysis.
Free Trial Available

Real-World Applications
In commodity markets, information asymmetry creates opportunity. While public reports lag by days or weeks, vessel movements reveal market dynamics in real-time. Here's how trading desks leverage maritime data for competitive advantage.
1Monitoring Maritime Chokepoints
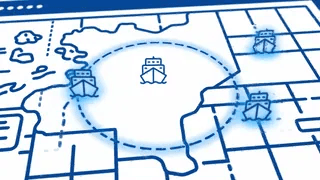
Key waterways like the Strait of Hormuz, Suez Canal, and Singapore Strait handle significant portions of global oil and LNG trade. When a VLCC diverts around the Cape of Good Hope instead of transiting Suez, it signals something. When tanker traffic through Hormuz drops unexpectedly, the market reacts.
- Set up geofenced alerts for vessels entering or exiting chokepoint regions
- Track transit volumes by vessel type and cargo capacity
- Detect unusual routing patterns that may signal supply disruptions
2Tracking Floating Storage
When tankers anchor for extended periods rather than proceeding to discharge, they become floating storage. This behavior often indicates contango markets where storing oil at sea becomes profitable. Monitoring floating storage levels provides early signals of supply/demand imbalances.
- Identify stationary laden tankers by combining position data with vessel particulars
- Calculate total floating storage volume by region
- Track changes in floating storage as a leading indicator
3Analyzing Terminal Activity
Loading and discharge activity at key terminals reveals export and import flows before official statistics are published. Tracking which VLCCs load at which terminals, and where they discharge, builds a real-time picture of trade routes.
- Monitor port call frequency at major oil terminals
- Track vessel dwell times to estimate loading volumes
- Map trade flows between producing and consuming regions
4Detecting Dark Fleet Activity
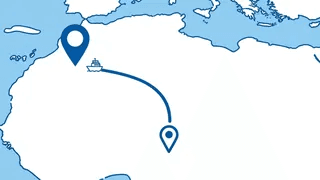
Vessels that disable AIS transponders or show irregular transmission patterns warrant attention. While there are legitimate reasons for gaps in AIS data, systematic patterns may indicate sanctioned trade or unreported ship-to-ship transfers.
- Identify vessels with sporadic AIS transmission patterns
- Cross-reference vessel ownership and flag state data
- Monitor known ship-to-ship transfer zones
Key Takeaway
By combining these analytical approaches, trading desks transform raw vessel data into actionable market intelligence. The key is systematic monitoring that surfaces signals before they become widely known.
From Raw AIS to Trading Signals
How vessel data transforms into market intelligence.
input
Global AIS Feed
process
Vessel Filtering
api
Vessel Location API
api
Vessels by Area API
api
Historical Vessel Data API
output
Trading Analytics
Input
Global AIS Feed
Data Docked APIs
Vessel Location API
Vessels by Area API
Historical Vessel Data API
Vessel Filtering
Output
Trading Analytics
Your Systems
API Endpoints
Output
“We spotted a significant rerouting pattern around the Cape before it hit the news. That 48-hour head start on market intelligence paid for our entire annual data subscription in a single trade.”
Ready to achieve similar results?
What You Can Achieve
Typical outcomes when implementing this use case
Real-time
Data Access
No more waiting for delayed reports
Global
Coverage
Monitor all major trade routes
2 Years
History
Deep historical data for pattern analysis
Any Vessel
Tracking
Filter by type, flag, ownership
Want to learn more about maritime data?
Explore our guides and documentation
Explore Other Use Cases
See how other industries use maritime data
Ready to Gain Market Edge?
Get real-time vessel intelligence for your trading desk.